One huge caveat that should be addressed first; the sample sizes used in this analysis are not the same. I couldn't find a way to get full stats on the 07/08 Wings at the All Star break, so we're comparing a full regular season's worth of data from 07/08 to 50 games worth of regular season data from 2011/12. That being said, I still think that enough games have been played to start comparing the two teams, especially when looking at averages. At the end of the day, this is just supposed to be a fun analysis that gives us some sort of measuring stick to compare this year's squad to. Oh, and if you're wondering why I chose the 07/08 team to compare this year's team against, it's really just because they won that shiny silver thing at the end of the rainbow. Nothing more scientific than that.
This post wouldn't be possible without the incomparable behindthenet.ca and nhl.com. If you're at all interested in hockey stats, check out behindthenet.ca. It's definitely the best and most in depth hockey stats site I've come across.
The first thing I broke down was even strength play. If you've read the blog before you know that it's really all about the screen caps, so this post wouldn't be complete without some sort of visual aid. In the graphs below, the 07/08 team is always on the left and the 11/12 team is always on the right.


Much more after the jump...
So the graphs look cool, but what does it all mean? In terms of methodology, all even strength goals are divided by total number of even strength minutes played. This is then multiplied by 60 to get the number of goals we can expect to be scored for every 60 minutes of even strength play (not just for every 60 minutes played). The 11/12 team is outscoring the 07/08 team on a per 60 minutes basis [2.9 gf/60 vs 2.7 gf/60]. At the same time, the 11/12 team is giving up more even strength goals per 60 minutes [2 ga/60 vs 1.8 ga/60].
Why is this happening? Fortunately we have statistics for the action that immediately precedes a goal, shots. This year's team is converting opportunities better than the 07/08 team did, but they're also allowing more shots on net. The 11/12 Wings are averaging 32.5 shots for per 60 minutes of even strength play, just a tick below the 07/08 team's average of 32.8 shots for per 60 minutes. The 11/12 Wings are averaging more goals on slightly less shots than the 07/08 team did. Unfortunately, the 11/12 Wings are allowing more shots per 60 minutes of even strength play compared to the 07/08 Cup champs [26.6 sa/60 vs 23.2 sa/60]. While not conclusive, this could help explain why the current Wings roster is allowing more goals for every 60 even strength minutes played.
Overall, the analysis run here makes the two teams appear close enough to equal to alleviate concern. While there is both encouraging news and room to improve, both the 11/12 and 07/08 teams are very close to each other across all the even strength statistics run. One last interesting statistic that shows how evenly matched the teams are is 5v5 +-/60min. This stat looks at goals scored and allowed at even strength, then converts it into how many goals a team can expect to be up or down after 60 minutes of even strength play. The 07/08 team is +0.8, while the 11/12 team is +1.0. It isn't until we look at the power play and penalty kill that we see some true differences in the two teams.

Moving on to the power play, we see that the current Wings are scoring slightly less on a per 60 minutes basis than the 07/08 Wings with the man advantage [6.6 gf/60 vs 6.8 gf/60]. While these numbers seem high for a power play, keep in mind that the numbers are per 60 minutes of power play time. This year's team is also more likely to give up a shorthanded goal [1.1 ga/60 vs 0.8 ga/60]. Overall, I find this a bit surprising. The Wings' power play has seemed anemic all year, but the numbers tell a different story. They aren't all that far off the pace of team whose power play was third best in the league during the 07/08 regular season, and ultimately got them a Stanley Cup. As far as the GA/60, I don't worry too much about short handed goals. It is what it is, as they say.

Unsurprisingly, the 07/08 team got more shots on net while on the power play than the 11/12 team has been able to thus far [61.9 sf/60 vs 54.8 sf/60]. Again, shots allowed while on the power play are fairly close [7.2 sa/60 in 07/08 vs 6.6 sa/60 in 11/12].
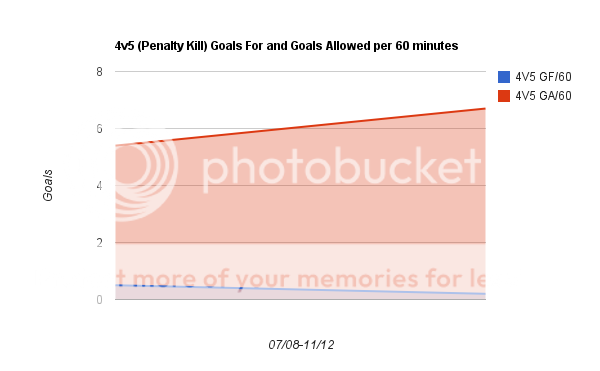

A potential weakness of this year's club rears its ugly head in the above two charts. The 11/12 Wings are giving up more goals and shots against on the penalty kill than the 07/08 Wings did [6.7 ga/60 vs 5.4 ga/60 and 48 sa/60 vs 39.9 sa/60, respectively].
This doesn't come as a complete surprise. Detroit is currently 22nd in penalty killing, and we're comparing them against an 07/08 Detroit team that finished 8th. The 07/08 unit finished at 84%, while this year's incarnation is at 81.2%.
We once again see the correlation between shots and goals, as the 11/12 unit is facing an average of 8.1 more shots per 60 penalty kill minutes and allowing an average of 1.3 more goals per 60 minutes.
As for shorthanded goals, the 07/08 team averaged 0.5 per 60 minutes on the PK, while the 11/12 team is averaging 0.2 per 60 minutes of PK time. It'd be nice if the current team was a little closer to the 0.5 gf/60 the 07/08 team was at, but all we can do is hope it doesn't play much of a role during the rest of the season. In my opinion, this is the statistic that I'm least worried about.
This leaves us with something of a mixed bag. In a nutshell, the 11/12 Wings are a great even strength team that needs to improve their special teams. They're outscoring the 07/08 Wings on average at even strength, while getting the puck on net at an almost equal rate. Though the 11/12 Wings are giving up 0.2 more goals and 3.4 more shots per 60 minutes than the 07/08 Wings, I'd say that their offensive output makes up for this and that they're still a good even strength team.
Real improvement needs to be seen on special teams. The 11/12 power play looks good (6.6 gf/60 this year vs 6.8 gf/60 in 07/08 and only 54.8 sf/60 this year vs 61.9 sf/60 in 07/08), but the penalty kill needs work. The current Wings penalty kill is allowing far too many shots and goals (48 sa/60 in 11/12 vs 39.9 sa/60 in 07/08 and 6.7 ga/60 this season vs 5.4 ga/60 in 07/08).
Overall, I think the fanbase can look at the current team's performance and be encouraged. They're shooting and scoring at even strength, and they're shooting less and scoring almost the same amount as the 07/08 team on the power play. The penalty kill could allow a few less shots and goals, but there are 32 games left to tweak that. This is a team that I truly believe has the necessary parts to be a serious Cup contender, not just a good playoff team, and I think the numbers bear that out.
No comments:
Post a Comment